Projects
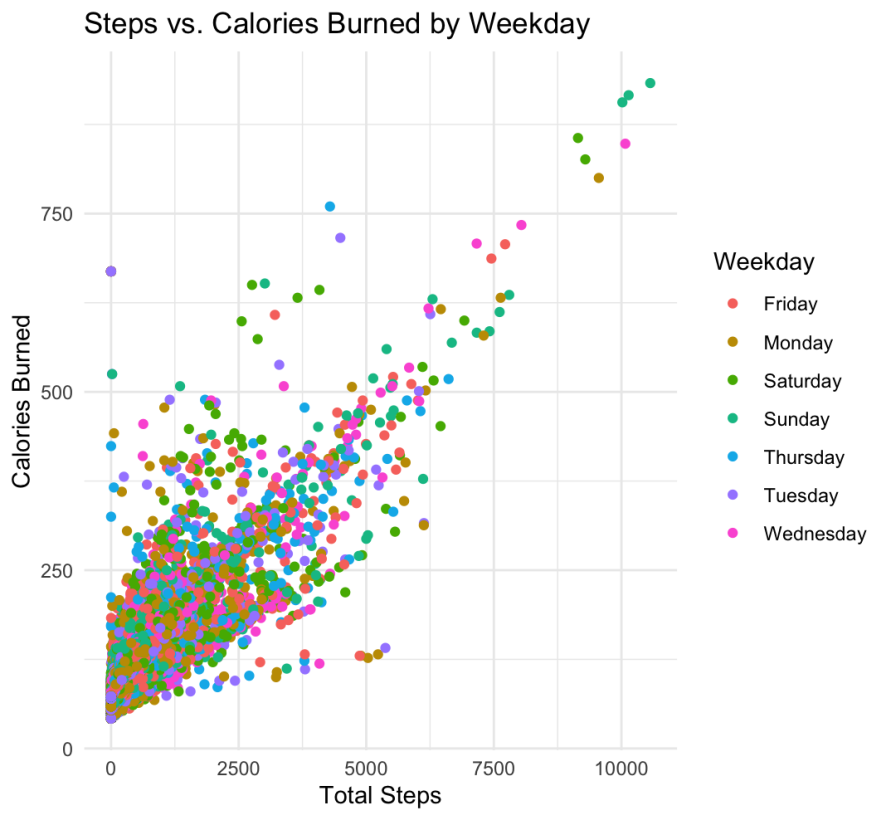
As a data analyst, the goal of this project was to find trends in smart watch activity usage to help influence company marketing strategies. I believe the marketing team would find this trend useful because it highlights the connection between activity levels and calories burned, making it easier to promote fitness products or campaigns that encourage walking as a simple way to stay healthy.
To achieve this it was necessary to combine two .csv datasets (steps_hourly and calories_hourly) that shared the same number of observations and user id's. However, a challenge arose when the observation count unexpectedly changed after attempting to merge the datasets using conventional join methods. This was a critical issue, as preserving the original observation count was essential for accurate analysis.
After much research, I was able to sucessfully align the datasets using the cbind() function in the R programming language. This solution preserved the observation count, ensuring the datasets were combined as intended. This project was executed in RStudio, using the tidyverse, lubridate, and janitor packages for data cleaning, manipulation, and visualization.
The results of this project demonstrates the power of R for data handling, analysis, and creating visualization patterns in ggplot2 for steps and calories burned on end users smart watches. This process highlights the importance of careful dataset handling in data analytics workflows.